Investor-Ready Reporting
The MRR story, told in the format a board or investor actually reads.
A structured, periodic summary — MRR/ARR trend, movement bridge, retention, concentration, geography, cashflow, forecast — packaged the way an investor or board member expects to consume it, instead of them reverse-engineering your dashboard. Good investor reporting anticipates the three questions every investor asks: is revenue growing, is it retained, and is it concentrated.
Worked example
A monthly one-pager: MRR $84,000 (+4.2% MoM), NRR 108%, top-5 customer concentration 31%, 6-month forecast range $92K–$101K, cash runway 14 months. Five numbers, no dashboard login required.
Benchmark
Reporting cadenceWhy it matters
Investors and board members don't want a dashboard tour, they want the same handful of numbers, in the same order, every period, so they can spot the trend without re-learning your reporting each time. A consistent investor report is also a forcing function: you can't hide a bad month behind a good headline MRR if concentration, retention, and cashflow are on the same page.
Common mistakes
- Changing which metrics are reported from period to period, making trends impossible to compare.
- Reporting only the flattering headline number (MRR growth) while omitting retention or concentration, which investors will ask for anyway.
- Sending a static screenshot with no way for the reader to trust the underlying numbers were reconciled against source data.
Tracked in FlowMRR
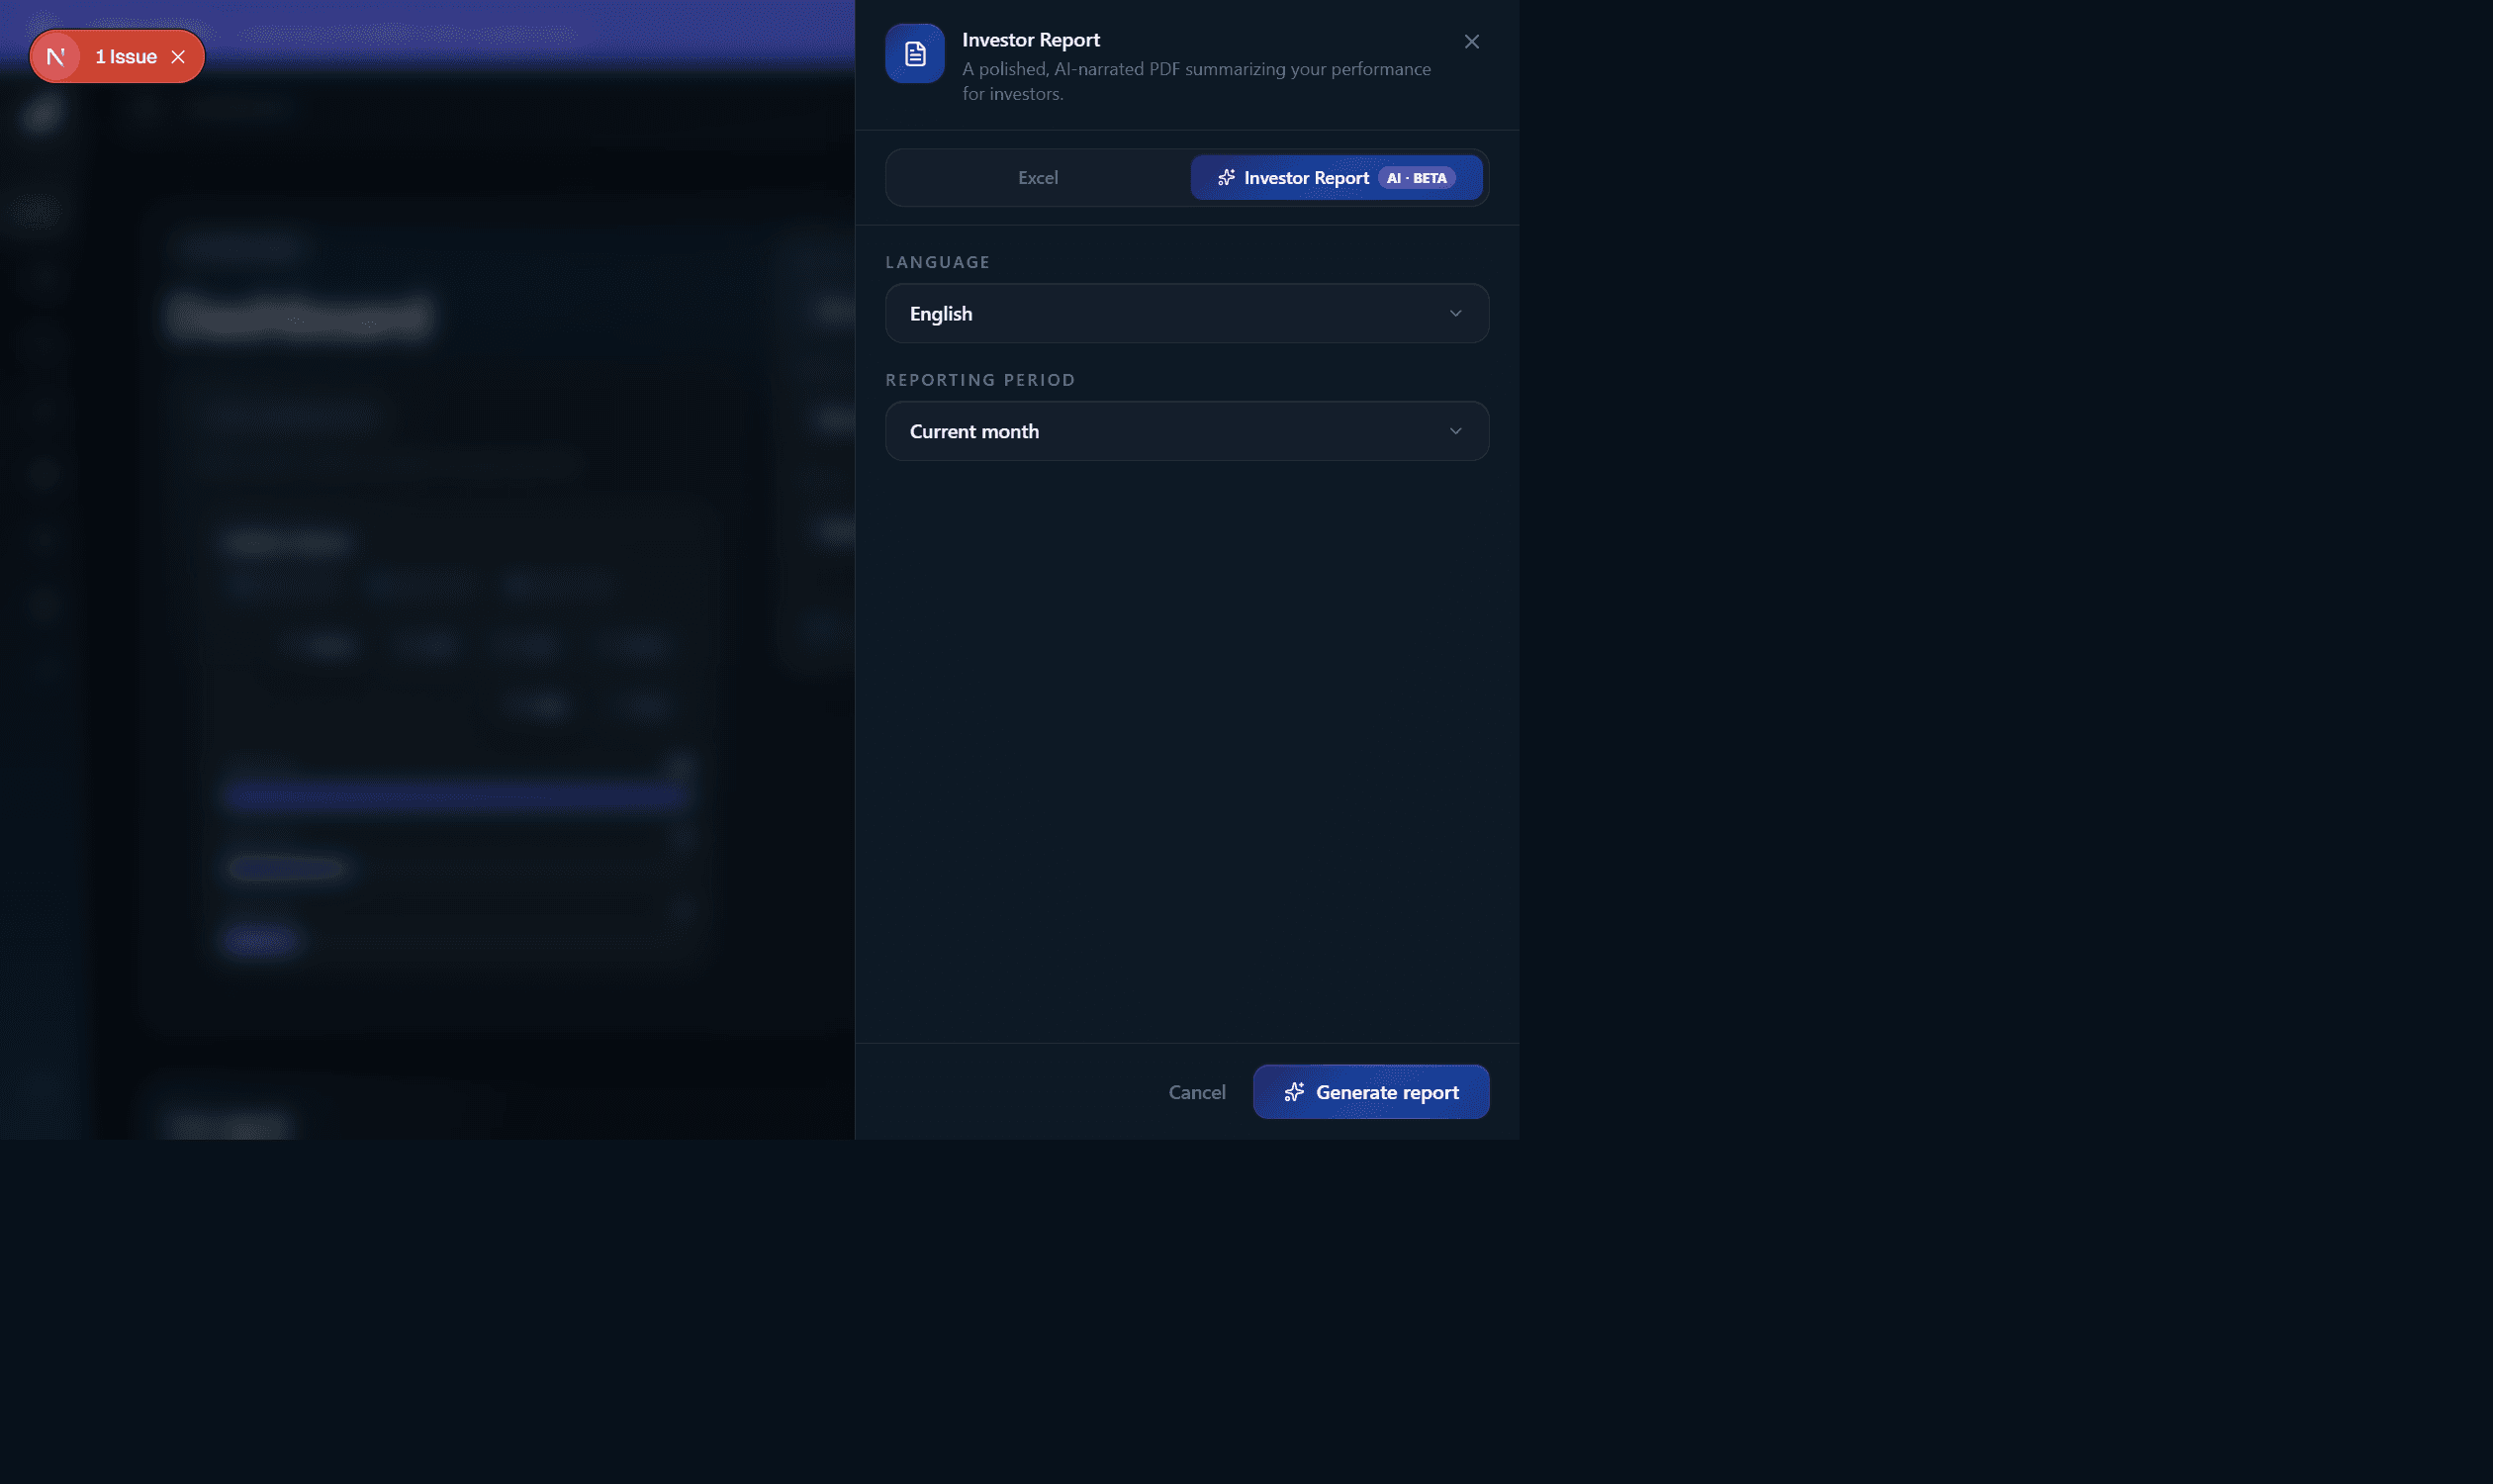
Dashboard → Export Report: a multi-section PDF (MRR, churn, concentration, geography, forecast) with a written analyst narrative, ready for your board.