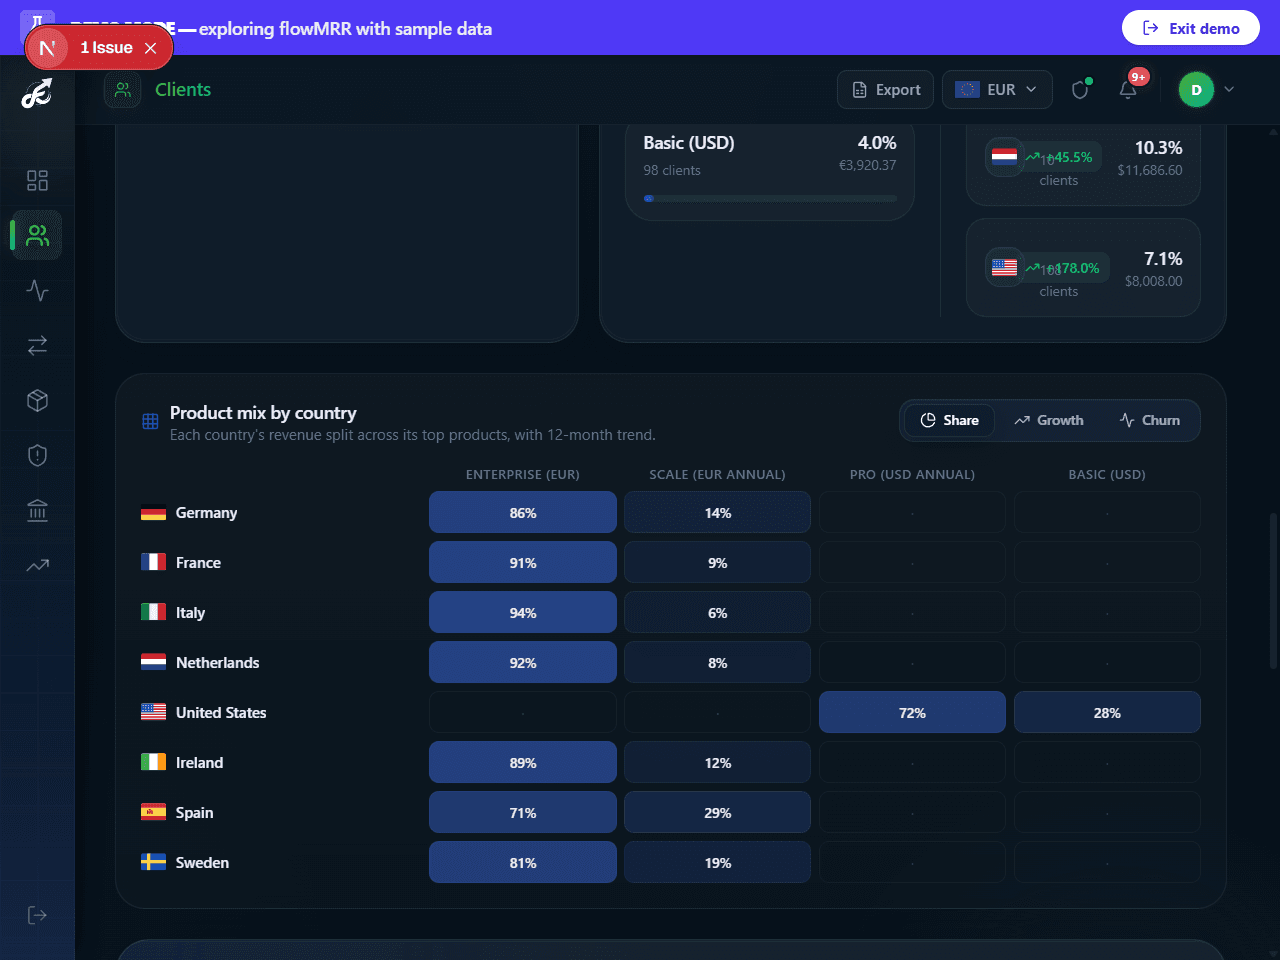
Geography & Product Mix
Where your revenue comes from, and which product it's tied to.
A country × product matrix showing how MRR splits across geographies and product lines simultaneously — not just "MRR by country" or "MRR by product" in isolation, but the intersection, which is where real go-to-market decisions live (e.g. "Product A dominates in the US, Product B is where France actually grows").
Worked example
US customers contribute $30,000 MRR, split $20,000 on the Pro plan and $10,000 on Team. France contributes $14,000, almost entirely on Team. That tells you Team, not Pro, is the plan to localise and market in France.
Benchmark
Reading the matrixWhy it matters
Geography without product (or product without geography) hides the decision you actually need to make. A country that looks flat in aggregate MRR can be growing fast on one product and shrinking on another — packaging, pricing, and localisation decisions should follow the cell in the matrix, not the row or column alone.
Common mistakes
- Reporting country-level MRR without segmenting by product — masks which offer is actually working where.
- Ignoring the customer-count view alongside the MRR view — a country can carry a lot of MRR from very few whales, which is a concentration risk in disguise.
- Letting an "unknown" or missing-country bucket grow unaddressed instead of fixing billing-address capture.
Tracked in FlowMRR
Clients → country × product matrix and world-map revenue drawer.